Planning a move to Austin means working with current numbers, not headlines left over from the pandemic boom. Housing prices have moderated, rents have softened, and the market has found a more balanced footing. This guide breaks down what Austin costs category by category so you can build a realistic budget before you arrive.
Key Insights
- Overall prices: Austin's overall price level is 98.1 (U.S. = 100), slightly below the national average and below Dallas-Fort Worth at 103.1 (BEA, 2024). Housing is the exception at 120.4.
- Home prices: The median sale price in the city is about $550,000 to $560,000, while the wider metro median is $412,000 (Redfin and Unlock MLS, August 2026).
- Rent: A one-bedroom has a median rent of $1,174 and a two-bedroom $1,429, with citywide rents down about 2.3% from a year ago (Apartment List, October 2026).
- Property tax: The combined 2026 rate for a City of Austin homeowner in Austin ISD is about $2.12 per $100 of taxable value, one of the most underestimated costs for new residents.
- Comfortable income: A single adult needs about $98,550 a year to live comfortably, and a family of four about $229,050 (SmartAsset, 2026).
- No state income tax: Texas has no state income tax, which offsets part of Austin's housing premium for households moving from California, New York, or Illinois.
- Childcare: The MIT Living Wage Calculator estimates childcare for two children at $23,856 a year in the Austin metro, roughly a quarter of the city's median household income.
Austin carries a premium on housing compared with most of Texas, and that premium comes with a strong job market, no state income tax, and a lifestyle that draws people from across the country. Below, you will find current figures for housing, utilities, taxes, food, transportation, healthcare, childcare, and entertainment, with sources for every number.
How Much Does It Cost to Live in Austin?
| Cost | Typical Austin figure | Source |
|---|---|---|
| Median home sale price (city) | About $550,000 to $560,000 | Redfin and Unlock MLS, Aug 2026 |
| Median home sale price (metro) | $412,000 | Unlock MLS, Aug 2026 |
| Median rent, 1-bedroom | $1,174 per month | Apartment List, Oct 2026 |
| Median rent, 2-bedroom | $1,429 per month | Apartment List, Oct 2026 |
| Combined property tax rate | About $2.12 per $100 of taxable value | Community Impact, 2026 rates |
| Basic utilities (915 sq ft apartment) | About $225 per month | Numbeo, Oct 2026 |
| Capital Metro local bus, monthly pass | $41.25 | CapMetro |
| Regular gas | About $3.92 per gallon | AAA, Oct 14, 2026 |
| Median household income | $93,658 | Census, 2020-2024 |
Figures change monthly. Last updated October 2026.
Austin's cost of living vs. the national average
The Bureau of Economic Analysis publishes Regional Price Parities that set the U.S. average at 100. For 2024, the Austin metro scored 98.1 for overall prices, meaning everyday goods and services cost about 2% less than the national average. Housing is the outlier: Austin's housing price level is 120.4, so housing costs about 20% more than the national average.
That split explains how Austin can feel expensive and affordable at the same time. Groceries, healthcare, and transportation are close to national norms, while housing, property taxes, and childcare are where Austin residents spend more.
How Austin compares to other major cities
| Metro area | Overall price level (U.S. = 100) |
|---|---|
| San Francisco | 115.6 |
| Los Angeles | 113.6 |
| New York | 112.6 |
| Denver | 105.8 |
| Dallas-Fort Worth | 103.1 |
| Austin | 98.1 |
Source: U.S. Bureau of Economic Analysis Regional Price Parities for 2024, via FRED (Austin, Dallas-Fort Worth). Metro-wide averages across all goods and services. Housing alone is higher in Austin (120.4) than in Dallas-Fort Worth (117.9).
Austin is less expensive overall than Dallas-Fort Worth and Denver, and meaningfully less expensive than Los Angeles, New York, or San Francisco. The picture shifts when you look at buying a home. Compare the two Texas metros side by side:
| Feature | Austin | Dallas |
|---|---|---|
| Overall price level (BEA, U.S. = 100) | 98.1 | 103.1 |
| Housing price level (BEA, U.S. = 100) | 120.4 | 117.9 |
| Median home sale price (Redfin) | About $550,000 | About $450,000 |
| Median rent, 1-bedroom (Apartment List) | $1,174 | $1,209 |
Sources: BEA via FRED (2024), Redfin, and Apartment List (October 2026). For a full comparison, see Austin vs. Dallas.
What income do you need to live comfortably in Austin?
It depends on how you define comfortable. The MIT Living Wage Calculator estimates that a single adult in the Austin metro needs $23.71 per hour, or about $49,322 a year before taxes, to cover basic necessities. That leaves little room for savings or extras.
| Household type | Living wage (MIT) | Comfortable salary (SmartAsset) |
|---|---|---|
| Single adult | $49,322 ($23.71 per hour) | $98,550 |
| One adult, one child | $82,396 | Not published |
| Two working adults, two children | $112,866 combined | $229,050 |
Sources: MIT Living Wage Calculator (Austin-Round Rock-San Marcos, updated February 2026) and SmartAsset (2026). A living wage covers basic needs only. SmartAsset adds room for wants and savings using the 50/30/20 rule.
For a deeper look at the budget behind these numbers, see our guide on how much it costs to live comfortably in Austin. Austin's median household income is $93,658 (Census, 2020-2024), so a typical household sits close to the single-adult comfort level but well below the family-of-four figure.
Housing Costs in Austin
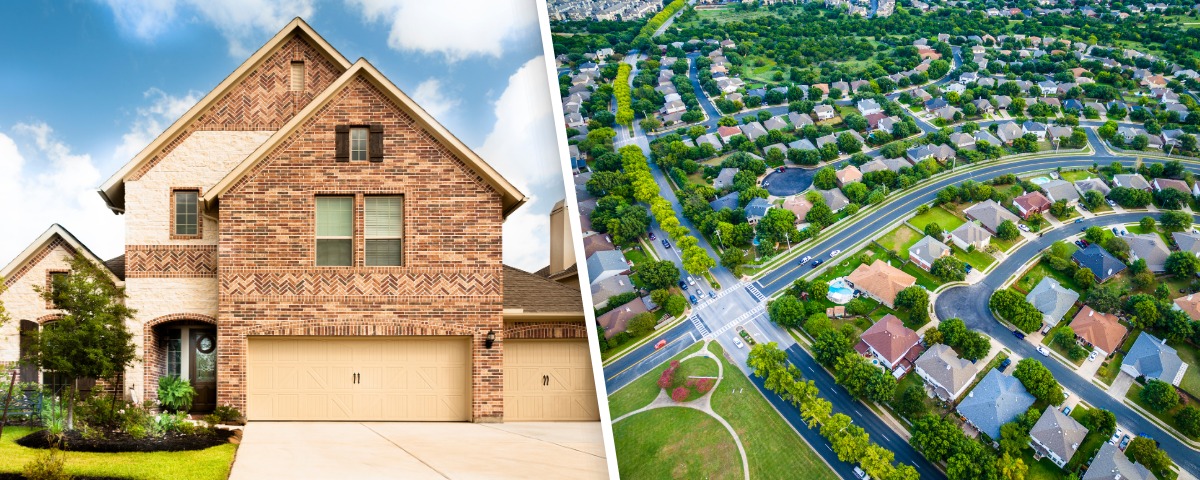
Housing is the single largest driver of Austin's cost of living premium, and the category that has changed the most since 2022. Prices have cooled from their peak, inventory has improved, and buyers have more room to negotiate than during the most competitive years.
Median home prices in Austin
| Measure | Median sale price | Source |
|---|---|---|
| City of Austin | $560,000 | Unlock MLS, Aug 2026 |
| City of Austin, 3 months ending Aug 2026 | $550,000 | Redfin |
| Austin-Round Rock-San Marcos metro | $412,000 | Unlock MLS, Aug 2026 |
Sources: Hoodline reporting Unlock MLS and Redfin data. The metro median is much lower than the city median because suburbs such as Round Rock, Pflugerville, and Kyle bring the average down. Last updated October 2026.
Prices vary considerably by location. Central Austin and established neighborhoods like Tarrytown, Barton Hills, and Travis Heights tend to carry the highest price tags, while suburbs such as Round Rock, Pflugerville, and Kyle bring the metro median down and offer more square footage per dollar. For buyers focused on value, our guide to affordable Austin neighborhoods walks through the most accessible areas.
To see what your income supports in today's market, read our post on how to afford a home in Austin.
Search homes for sale in Austin
Median rent in Austin
| Unit | Median or typical rent | Source |
|---|---|---|
| 1-bedroom | $1,174 | Apartment List, Oct 2026 |
| 2-bedroom | $1,429 | Apartment List, Oct 2026 |
| 1-bedroom, city center | $1,924 | Numbeo, Oct 2026 |
| 1-bedroom, outside city center | $1,291 | Numbeo, Oct 2026 |
| 3-bedroom, outside city center | $2,571 | Numbeo, Oct 2026 |
Sources: Apartment List (rents are down about 2.3% from a year earlier) and Numbeo, which is based on user-submitted prices and is best used for location comparisons.
Rents have softened from their 2022 highs as a wave of new apartment supply came online. Renters in Central Austin and near downtown pay the most, while suburbs like Cedar Park, Pflugerville, and Buda often offer lower rents with newer construction and more space.
Utility costs in Austin

Utilities follow a seasonal pattern that new residents, especially those arriving from mild climates, sometimes underestimate. Numbeo reports about $225 per month for basic utilities (electricity, heating, cooling, water, and garbage) for a 915 square foot apartment, plus about $70 for broadband. Larger homes cost more, and electric bills climb sharply in July and August when air conditioning runs constantly. Austin Energy is the main provider for most in-city residents.
The city proposed utility rate increases in August 2026, including 3.1% for Austin Energy and 7.8% for Austin Water, which together would add about $137 a year for a typical customer. Home insurance and car insurance are also meaningful costs that have risen as insurers have repriced Texas risk, so get quotes for your specific address and vehicle.
Austin property taxes: what new residents often miss
Because Texas has no state income tax, local services and schools rely heavily on property taxes. For a City of Austin homeowner in Austin ISD, the combined 2026 rate is about $2.12 per $100 of taxable value.
| Taxing entity | 2026 rate per $100 of taxable value |
|---|---|
| City of Austin | $0.5799 |
| Travis County | $0.3862 |
| Central Health | $0.1329 |
| Austin ISD | $0.9184 |
| Austin Community College | $0.1036 |
| Combined (my sum of the five) | About $2.12 |
Source: Community Impact. Other school districts, such as Eanes and Pflugerville ISD, and special districts change the total for some addresses. The 2026 bills are due February 1, 2027.
Your actual bill is lower than the combined rate times the purchase price, because exemptions and appraisal caps reduce taxable value. Texas voters approved a larger school homestead exemption in November 2025, raising it from $100,000 to $140,000 for a primary residence. Ownwell estimates a median effective tax rate of about 1.25% for Austin, with a median annual bill of $7,479 (Ownwell, 2026). Check your exact address, since school districts and special districts change the total.
Buyers relocating from states with low property taxes, such as California or Colorado, are sometimes surprised by this recurring cost even when the purchase price feels manageable. Build it into your monthly budget before you sign a contract. For a full breakdown, see our post on Austin property tax rates.
Cost of Food in Austin

Food costs in Austin are close to national norms, and the density of restaurant options at every price point gives residents plenty of flexibility in how they allocate their food budget.
Groceries in Austin
| Item | Typical Austin price |
|---|---|
| White bread (1 lb) | $3.33 |
| Eggs (dozen, large) | $4.27 |
| Chicken fillets (1 lb) | $6.40 |
| Inexpensive restaurant meal | $20.50 |
| Mid-range meal for two (3 courses, no drinks) | $85.00 |
Source: Numbeo, October 2026. User-submitted prices, so treat them as estimates.
H-E-B is the dominant grocery chain in Austin and typically the most cost-effective option, with a wide selection and well-located stores across the metro. Whole Foods, Central Market, and specialty stores serve a different part of the market at higher price points. MIT estimates annual food costs of about $4,047 for a single adult.
Dining out in Austin
Austin's restaurant scene is one of the city's genuine strengths, from breakfast taco trucks to nationally recognized barbecue and James Beard-recognized restaurants. A casual meal costs around $20 per person, and a mid-range dinner for two runs about $85 before drinks. Residents who use Austin's food truck culture and neighborhood taco spots can eat well for meaningfully less.
Getting Around Austin: Transportation Costs
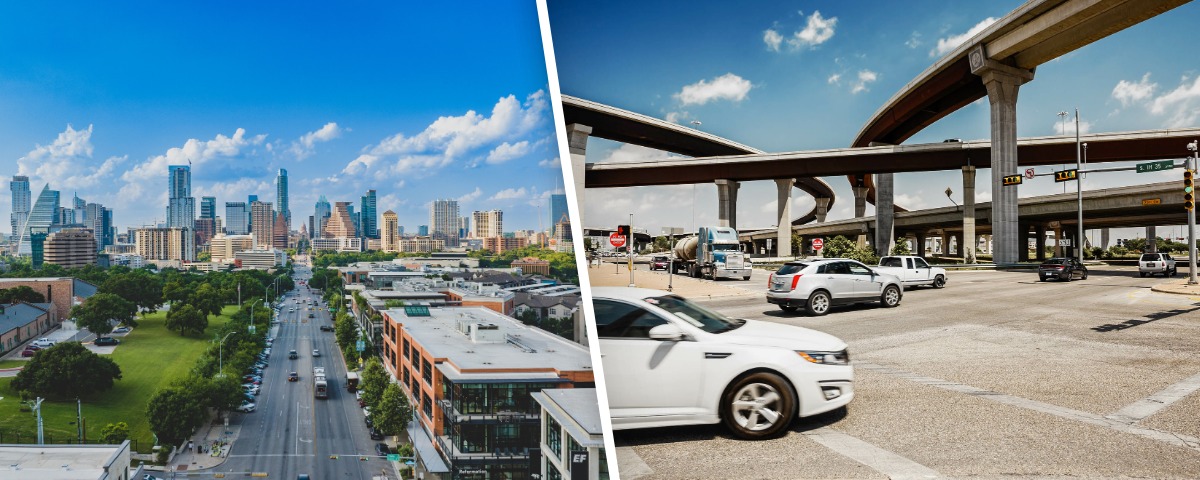
Austin is car-dependent for most residents. Transit and cycling infrastructure have expanded in recent years, but most daily commutes still happen by personal vehicle. The average commute in the city is 23.7 minutes (Census, 2020-2024). MIT estimates annual transportation costs of $9,016 for a single adult in the Austin metro.
Driving and gas costs
Regular gas averaged about $3.92 per gallon in the Austin area in October 2026 (AAA). Add insurance, registration, maintenance, depreciation, and any parking costs to get your full cost of car ownership, and carry that number into your housing affordability calculation.
Capital Metro bus and rail fares
Capital Metro operates the city's bus and rail network. Current fares:
| Fare type | Single ride | Day pass | Monthly pass |
|---|---|---|---|
| Local bus | $1.25 | $2.50 | $41.25 |
| Commuter (express and MetroRail) | $3.50 | $7.00 | $96.25 |
Source: Capital Metro. CapMetro has announced a fare increase starting January 10, 2027. Kids under 18 ride free, and reduced fares are available.
For residents who live and work along transit corridors, Capital Metro is a cost-effective alternative to full car ownership. The MetroRail line connects Leander through downtown Austin and suits residents in the northwest suburbs. For most of the metro, transit works best as a supplement to driving. See our guide to Austin public transportation for more.
Rideshare and other options
Uber and Lyft operate throughout Austin and work well for occasional trips, but costs add up quickly if you rely on them daily. Austin also has a growing network of bike lanes and shared scooter services for short trips in central neighborhoods.
Healthcare and Childcare Costs in Austin
| Annual expense (MIT) | Single adult | One adult, one child | Two working adults, two children |
|---|---|---|---|
| Housing | $17,779 | $22,338 | $22,338 |
| Food | $4,047 | $5,937 | $11,845 |
| Child care | $0 | $12,091 | $23,856 |
| Transportation | $9,016 | $10,435 | $15,124 |
| Medical | $3,075 | $8,955 | $10,182 |
Source: MIT Living Wage Calculator, Austin-Round Rock-San Marcos metro, updated February 2026. These are modest-budget estimates, not averages of what every family spends.
Healthcare costs in Austin

MIT estimates annual medical costs of $3,075 for a single adult and $8,955 for one adult with one child in the Austin metro. Austin has a strong network of hospital systems, including Ascension Seton, St. David's HealthCare, and Dell Seton Medical Center at The University of Texas, with good access to specialists and urgent care across the metro.
Childcare costs in Austin

Childcare is one of Austin's biggest cost pressure points for families. MIT estimates $12,091 a year for one child and $23,856 a year for two children, which is about $1,988 a month. That equals roughly 26% of the city's median household income of $90,430 (Census ACS, 2024), based on a simple calculation.
Families typically choose among daycare centers, full-time nannies, nanny shares, after-school programs, and app-based sitters. Prices vary widely by age, facility, and hours, so get current quotes before you finalize your housing budget. The two numbers together determine what is realistic.
Entertainment and Lifestyle Costs in Austin

Austin's entertainment options span a wide range of price points, from free trails and parks to world-class music festivals and major sporting events. What you spend depends largely on lifestyle, but many of the city's best features are free or low cost.
Live music and festivals
Austin holds its reputation as the Live Music Capital of the World, with a density of venues few cities can match. Local club shows range from free to modest cover charges, while national touring acts at ACL Live or Stubb's cost more. The Austin City Limits Music Festival and South by Southwest are the big annual draws, with ticket prices that vary widely by access level, so check current pricing before you plan.
Outdoor activities
The Barton Creek Greenbelt, the Veloway, and the Bull Creek District are free to use, and Barton Springs Pool charges a modest admission. Kayaking and paddleboarding on Lady Bird Lake are free if you own your equipment and inexpensive to rent if you do not. Lake Travis access through private resorts and marinas adds fees.
Sports and events
The University of Texas Longhorns draw big crowds to Darrell K Royal Stadium, and Austin FC plays at Q2 Stadium. Ticket prices swing widely by opponent and seat location, so check the team sites for current pricing.
Average Salaries in Austin

Austin's labor market has stayed relatively strong even as the national tech sector contracted. A diversified economy anchored by technology, healthcare, government, and education continues to support above-average wages compared with many U.S. metros.
Median household income in Austin
The median household income in Austin is $93,658 (Census, 2020-2024) and $90,430 in the 2024 American Community Survey one-year estimate. The Austin metro's unemployment rate was 3.9% in August 2026 (BLS, not seasonally adjusted, preliminary).
Top-paying industries in Austin
The highest-paying industries include technology and software, semiconductor manufacturing, financial services, healthcare and life sciences, and state and local government. Employers such as Dell Technologies, Apple, Tesla, and Samsung have significant operations in the area. Retail, hospitality, and food service employ a large share of the workforce at much lower wages, and that gap is why median figures can tell a different story than averages.
No state income tax: how it affects your take-home pay
Texas has no state income tax, which matters for households relocating from high-tax states. California's top marginal rate is 13.3% at very high incomes, and middle-income earners there still pay thousands of dollars a year, so moving to Texas can raise take-home pay noticeably. New York, Illinois, and Massachusetts residents see similar benefits.
This does not erase Austin's housing premium, but it changes the real cost comparison. Because Texas relies on property taxes, model both when comparing relocation options. If you are planning a full move, our guide on relocating to Austin covers the key financial and logistical decisions.
Frequently Asked Questions About the Cost of Living in Austin, TX
Is Austin expensive to live in?
Austin is expensive for housing but about average overall. The Bureau of Economic Analysis puts Austin's overall price level at 98.1 (U.S. = 100) in 2024, but its housing price level at 120.4. The median home sale price in the city is about $550,000 (Redfin), and rent for a one-bedroom is about $1,174 (Apartment List). Austin is far cheaper than Los Angeles, New York, or San Francisco.
What salary do you need to live comfortably in Austin?
A single adult needs about $98,550 a year to live comfortably in Austin, according to SmartAsset's 2026 study. A family of four needs about $229,050. For basic needs only, the MIT Living Wage Calculator puts a single adult at $49,322 a year, or $23.71 per hour. See our full guide on how much it costs to live comfortably in Austin for the budget breakdown.
Is Austin cheaper than Los Angeles?
Yes. Austin's overall price level is 98.1 compared with 113.6 for Los Angeles (U.S. = 100, BEA 2024). Texas also has no state income tax, while California's top rate is 13.3% and middle incomes still pay thousands of dollars a year, so the difference in take-home pay is meaningful for many households.
Is Austin more expensive than Dallas?
Not overall, but housing costs more. BEA's 2024 data puts Austin's overall price level at 98.1 versus 103.1 for Dallas-Fort Worth, while Austin's housing level is higher (120.4 versus 117.9). Austin's median home price is roughly $100,000 higher than Dallas, and rents are about the same.
What is the biggest hidden cost of living in Austin?
Property taxes. Because Texas has no state income tax, local services and schools rely heavily on property taxes. A City of Austin homeowner in Austin ISD faces a combined rate of about $2.12 per $100 of taxable value in 2026. Homestead exemptions and appraisal caps lower the effective rate: Ownwell estimates a median effective rate of about 1.25% and a median annual bill of $7,479. Include property tax in your monthly housing budget before you buy.
Understanding What Austin Actually Costs
Austin costs more than most of Texas for housing, but overall prices sit near the national average. Groceries and healthcare track national norms. There is no state income tax, and the job market continues to attract employers across industries. Compared with the coastal metros that many arrivals are leaving behind, the trade looks reasonable for the right household.
The categories that need the most planning are housing, property taxes, and childcare. Together they can absorb a large share of even a strong income, and they are the ones most likely to surprise people who rely on national averages. If you are planning a move to Austin and want to understand how the numbers work for your situation, the team at Spyglass Realty is here to help. Schedule a conversation with a Spyglass agent.
Share your timeline, budget, and priorities, and we will help you build a focused plan.
Disclaimer: This article is for general educational purposes only and is not legal, tax, or financial advice. Every situation is different. Before making decisions about buying or selling a home, consult your own real estate professional, lender, tax advisor, and other qualified professionals.
Sources: BEA via FRED (Austin), BEA via FRED (Dallas-Fort Worth), MIT Living Wage Calculator, SmartAsset, Hoodline (Redfin and Unlock MLS), Apartment List, Numbeo, Community Impact, Ownwell, Capital Metro, AAA, U.S. Census Bureau, BLS, CBS Austin. Figures change often. Last updated October 2026.